|
900
|
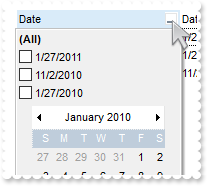
How do I get sorted the column as string, numeric, date, date and time. Also how can it be applied to drop down filter panel
with thisform.Gantt1
	.BeginUpdate
	.Chart.PaneWidth(1) = 0
	with .Columns.Add("Date")
		.SortType = 2
		.DisplayFilterButton = .T.
		.DisplayFilterPattern = .F.
		.DisplayFilterDate = .T.
		.FilterList = 1296 && FilterListEnum.exShowFocusItem Or FilterListEnum.exShowCheckBox Or FilterListEnum.exSortItemsDesc
	endwith
	with .Columns.Add("DateTime")
		.SortType = 3
		.DisplayFilterButton = .T.
		.DisplayFilterPattern = .F.
		.FilterList = 1296 && FilterListEnum.exShowFocusItem Or FilterListEnum.exShowCheckBox Or FilterListEnum.exSortItemsDesc
	endwith
	with .Columns.Add("Time")
		.SortType = 4
		.DisplayFilterButton = .T.
		.DisplayFilterPattern = .F.
		.FilterList = 1296 && FilterListEnum.exShowFocusItem Or FilterListEnum.exShowCheckBox Or FilterListEnum.exSortItemsDesc
		.FormatColumn = "time(value)"
	endwith
	with .Columns.Add("Numeric")
		.SortType = 1
		.DisplayFilterButton = .T.
		.FilterList = 1296 && FilterListEnum.exShowFocusItem Or FilterListEnum.exShowCheckBox Or FilterListEnum.exSortItemsDesc
	endwith
	with .Columns.Add("String")
		.DisplayFilterButton = .T.
		.FilterList = 1296 && FilterListEnum.exShowFocusItem Or FilterListEnum.exShowCheckBox Or FilterListEnum.exSortItemsDesc
	endwith
	with .Items
		h = .AddItem({^2010-1-27})
		.CellCaption(h,1) = {^2010-1-27 10:00:00}
		.CellCaption(h,2) = .CellCaption(h,1)
		.CellCaption(h,3) = 1
		.CellCaption(h,4) = .CellCaption(h,3)
		h = .AddItem({^2011-1-27})
		.CellCaption(h,1) = {^2011-1-27 9:00:00}
		.CellCaption(h,2) = .CellCaption(h,1)
		.CellCaption(h,3) = 11
		.CellCaption(h,4) = .CellCaption(h,3)
		h = .AddItem({^2010-11-2})
		.CellCaption(h,1) = {^2010-11-2 9:00:00}
		.CellCaption(h,2) = .CellCaption(h,1)
		.CellCaption(h,3) = 2
		.CellCaption(h,4) = .CellCaption(h,3)
	endwith
	.Columns.Item("DateTime").DisplayFilterDate = .F.
	.EndUpdate
endwith
|
|
899
|
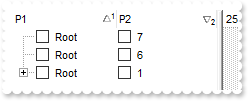
I am using Layout property to sort multiple columns at once. The problem is that all items get expanded. How do I prevent that
with thisform.Gantt1
	.BeginUpdate
	.LinesAtRoot = -1
	with .Columns.Add("P1")
		.Def(0) = .T.
		.PartialCheck = .T.
	endwith
	with .Columns.Add("P2")
		.Def(0) = .T.
		.PartialCheck = .T.
		.FormatColumn = "1 index ``"
	endwith
	with .Items
		h = .AddItem("Root")
		.InsertItem(h,Null,"Child A")
		.InsertItem(h,Null,"Child B")
		.InsertItem(h,Null,"Child A")
		.InsertItem(h,Null,"Child B")
		.AddItem("Root")
		.AddItem("Root")
	endwith
	.SingleSort = .F.
	.Layout = "multiplesort="+chr(34)+"C0:1 C1:2"+chr(34)+";collapse="+chr(34)+""+chr(34)+""
	.EndUpdate
endwith
|
|
898
|
How can I get ride / hide the image being dragged by OLE Drag and Drop
*** OLEStartDrag event - Occurs when the OLEDrag method is called. ***
LPARAMETERS Data, AllowedEffects
	*** Data.SetData("data to drag")
	with thisform.Gantt1
		AllowedEffects = 1
	endwith

with thisform.Gantt1
	.OLEDropMode = 1
	.Object.Background(34) = RGB(255,255,255)
	.LinesAtRoot = -1
	.Columns.Add("Default")
	with .Items
		h = .AddItem("Root")
		.InsertItem(h,Null,"Child 1")
		.InsertItem(h,Null,"Child 2")
		.ExpandItem(h) = .T.
	endwith
endwith
|
|
897
|
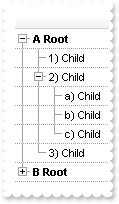
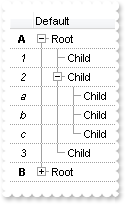
I'm trying to use automatic numbering of the outline. How can I have A, B, C for root items, 1, 2, 3 for the sub-items, and a, b, c for sub-sub-items (sample 3)
with thisform.Gantt1
	.BeginUpdate
	.LinesAtRoot = -1
	.DrawGridLines = -2
	.AutoDrag = 3
	.HasLines = 1
	.Indent = 16
	.MarkSearchColumn = .F.
	with .Columns
		with .Add("")
			.Def(17) = 1
			.FormatColumn = "((1:=(0 :=(1 rpos '.|A-Z||a-z|')) rfind `.`) < 0 ? `<b>` + =:0 + `` :  (=:0 mid (1 + 1 + =:1) )  + `)` ) + ` ` + value"
		endwith
	endwith
	with .Items
		h = .AddItem("Root")
		.InsertItem(h,Null,"Child")
		hChild = .InsertItem(h,Null,"Child")
		.InsertItem(hChild,Null,"Child")
		.InsertItem(hChild,Null,"Child")
		.InsertItem(hChild,Null,"Child")
		.InsertItem(h,Null,"Child")
		.ExpandItem(0) = .T.
		h = .AddItem("Root")
		.InsertItem(h,Null,"Child")
		hChild = .InsertItem(h,Null,"Child")
		.CellState(hChild,0) = 1
		.InsertItem(hChild,Null,"Child")
		.InsertItem(hChild,Null,"Child")
		.InsertItem(hChild,Null,"Child")
		.InsertItem(h,Null,"Child")
	endwith
	.EndUpdate
endwith
|
|
896
|
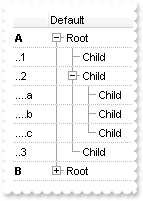
I'm trying to use automatic numbering of the outline. How can I have A, B, C for root items, 1, 2, 3 for the sub-items, and a, b, c for sub-sub-items (sample 2)
with thisform.Gantt1
	.BeginUpdate
	.LinesAtRoot = -1
	.GridLineColor = RGB(190,190,190)
	.DrawGridLines = -2
	.AutoDrag = 3
	.HasLines = 1
	.Indent = 16
	with .Columns
		.Add("Default")
		with .Add("")
			.Def(17) = 1
			.Def(49) = 4
			.AllowSizing = .F.
			.Width = 36
			.Position = 0
			var_s = "(1:=(0 :=(1 rpos '.|A-Z||a-z|')) rfind `.`) < 0 ? `<b>` + =:0 : (`............` left 2 * (=:0 count `.`)) + (=:0 mid (1 + 1 + =:"
			var_s = var_s + "1) ) "
			.FormatColumn = var_s
		endwith
	endwith
	with .Items
		h = .AddItem("Root")
		.InsertItem(h,Null,"Child")
		hChild = .InsertItem(h,Null,"Child")
		.InsertItem(hChild,Null,"Child")
		.InsertItem(hChild,Null,"Child")
		.InsertItem(hChild,Null,"Child")
		.InsertItem(h,Null,"Child")
		.ExpandItem(0) = .T.
		h = .AddItem("Root")
		.InsertItem(h,Null,"Child")
		hChild = .InsertItem(h,Null,"Child")
		.CellState(hChild,0) = 1
		.InsertItem(hChild,Null,"Child")
		.InsertItem(hChild,Null,"Child")
		.InsertItem(hChild,Null,"Child")
		.InsertItem(h,Null,"Child")
	endwith
	.EndUpdate
endwith
|
|
895
|
I'm trying to use automatic numbering of the outline. How can I have A, B, C for root items, 1, 2, 3 for the sub-items, and a, b, c for sub-sub-items (sample 1)
with thisform.Gantt1
	.BeginUpdate
	.LinesAtRoot = -1
	.DrawGridLines = -2
	.AutoDrag = 3
	.HasLines = 1
	.Indent = 16
	with .Columns
		.Add("Default")
		with .Add("")
			.Def(17) = 1
			.Def(49) = 4
			.Alignment = 2
			.AllowSizing = .F.
			.Width = 24
			.Position = 0
			.FormatColumn = "(1:=(0 :=(1 rpos '.|A-Z||a-z|')) rfind `.`) < 0 ? `<b>` + =:0 : `<i>` + (=:0 mid (1 + 1 + =:1) ) "
		endwith
	endwith
	with .Items
		h = .AddItem("Root")
		.InsertItem(h,Null,"Child")
		hChild = .InsertItem(h,Null,"Child")
		.InsertItem(hChild,Null,"Child")
		.InsertItem(hChild,Null,"Child")
		.InsertItem(hChild,Null,"Child")
		.InsertItem(h,Null,"Child")
		.ExpandItem(0) = .T.
		h = .AddItem("Root")
		.InsertItem(h,Null,"Child")
		hChild = .InsertItem(h,Null,"Child")
		.CellState(hChild,0) = 1
		.InsertItem(hChild,Null,"Child")
		.InsertItem(hChild,Null,"Child")
		.InsertItem(hChild,Null,"Child")
		.InsertItem(h,Null,"Child")
	endwith
	.EndUpdate
endwith
|
|
894
|
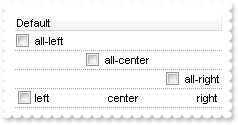
Is it possible to have a different alignment for parts of the cell's caption
with thisform.Gantt1
	.BeginUpdate
	.TreeColumnIndex = -1
	.DrawGridLines = -2
	.Chart.PaneWidth(1) = 0
	with .Columns.Add("Default")
		.Def(0) = .T.
	endwith
	with .Items
		.CellHAlignment(.AddItem("all-left"),0) = 0
		.CellHAlignment(.AddItem("all-center"),0) = 1
		.CellHAlignment(.AddItem("all-right"),0) = 2
		h = .AddItem("left<c>center<r>right")
		.CellCaptionFormat(h,0) = 1
	endwith
	.EndUpdate
endwith
|
|
893
|
I have a column with Def(exCellSingleLine) property on False, word-wrapping, and I am wondering if possible to update the column's content while user is resizing it
with thisform.Gantt1
	.BeginUpdate
	.Chart.PaneWidth(1) = 0
	with .Columns
		with .Add("MultipleLine")
			.Width = 32
			.Def(16) = .F.
			.Def(64) = .T.
		endwith
		with .Add("SingleLine")
			.Def(16) = .F.
		endwith
	endwith
	with .Items
		.CellCaption(.AddItem("This is a bit of long text that should break the line"),1) = "This is a bit of long text that should break the line"
	endwith
	.EndUpdate
endwith
|
|
892
|
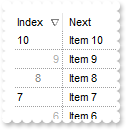
How do I sort the index column as numeric
*** AddItem event - Occurs after a new Item has been inserted to Items collection. ***
LPARAMETERS Item
	with thisform.Gantt1
		with .Items
			.CellData(Item,1) = .ItemToIndex(Item)
		endwith
	endwith

with thisform.Gantt1
	.BeginUpdate
	.DrawGridLines = -1
	.ColumnAutoResize = .T.
	.ShowFocusRect = .F.
	with .Columns.Add("Next")
		.Def(48) = 4
		.Def(52) = 4
	endwith
	with .Columns.Add("Index")
		.AllowSizing = .F.
		.Width = 48
		.FormatColumn = "(((0 := (1 index ``)) mod 3) case ( default: ``; 0 : `<r><fgcolor=B0B0B0>`; 1: ``; 2 : `<c><fgcolor=808080>` )) + str(=:0)"
		.Def(17) = 1
		.SortType = 5
		.Position = 0
	endwith
	with .Items
		.AddItem("Item 1")
		.AddItem("Item 2")
		.AddItem("Item 3")
		.AddItem("Item 4")
		.AddItem("Item 5")
		.AddItem("Item 6")
		.AddItem("Item 7")
		.AddItem("Item 8")
		.AddItem("Item 9")
		.AddItem("Item 10")
	endwith
	.EndUpdate
endwith
|
|
891
|
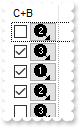
How can I put icons/images into buttons
with thisform.Gantt1
	.BeginUpdate
	.ColumnAutoResize = .T.
	var_s = "gBJJgBAIDAAGAAEAAQhYAf8Pf4hh0QihCJo2AEZjQAjEZFEaIEaEEaAIAkcbk0olUrlktl0vmExmUzmk1m03nE5nU7nk9n0/oFBoVDolFo1HpFJpVLplNp1PqFRqVTql"
	var_s = var_s + "Vq1XrFZrVbrldr1fsFhsVjslls1ntFptVrtltt1vuFxuVzul1u13vF5vV7vl9v1/wGBwWDwmFw2HxGJxWLxmNx0xiFdyOTh8Tf9ZymXx+QytcyNgz8r0OblWjyWds+m0"
	var_s = var_s + "ka1Vf1ta1+r1mos2xrG2xeZ0+a0W0qOx3GO4NV3WeyvD2XJ5XL5nN51aiw+lfSj0gkUkAEllHanHI5j/cHg8EZf7w8vl8j4f/qfEZeB09/vjLAB30+kZQAP/P5/H6/yN"
	var_s = var_s + "AOAEAwCjMBwFAEDwJBMDwLBYAP2/8Hv8/gAGAD8LQs9w/nhDY/oygIA="
	.Images(var_s)
	with .Columns.Add("C+B")
		.AllowSizing = .F.
		.Width = 48
		.FormatColumn = "` <img>` + ( 1 + (1 index ``) mod 3 ) + `</img> `"
		.Def(17) = 1
		.Def(0) = .T.
		.Def(2) = .T.
		.Def(3) = .T.
	endwith
	.Columns.Add("")
	.DrawGridLines = 2
	.DefaultItemHeight = 20
	with .Items
		.AddItem("")
		.AddItem("")
		.AddItem("")
		.AddItem("")
		.AddItem("")
		.AddItem("")
		.AddItem("")
		.AddItem("")
	endwith
	.EndUpdate
endwith
|
|
890
|
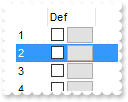
Is it possible to have a CheckBox and Button TOGETHER on all cells in a column
*** CellButtonClick event - Fired after the user clicks on the cell of button type.  ***
LPARAMETERS Item, ColIndex
	with thisform.Gantt1
			DEBUGOUT( "CellButtonClick" )
		DEBUGOUT( Item )
	endwith

*** CellStateChanged event - Fired after cell's state has been changed. ***
LPARAMETERS Item, ColIndex
	with thisform.Gantt1
			DEBUGOUT( "CellStateChanged" )
		DEBUGOUT( Item )
	endwith

with thisform.Gantt1
	.BeginUpdate
	.ColumnAutoResize = .T.
	with .Columns.Add("")
		.AllowSizing = .F.
		.Width = 32
		.FormatColumn = "1 index ``"
	endwith
	with .Columns.Add("Def")
		.AllowSizing = .F.
		.Width = 48
		.FormatColumn = "`     `"
		.Def(0) = .T.
		.Def(2) = .T.
		.Def(3) = .T.
	endwith
	.Columns.Add("")
	with .Items
		.AddItem("")
		.AddItem("")
		.AddItem("")
		.AddItem("")
		.AddItem("")
		.AddItem("")
		.AddItem("")
		.AddItem("")
	endwith
	.EndUpdate
endwith
|
|
889
|
Does filtering work with umlauts / accents characters
with thisform.Gantt1
	.BeginUpdate
	.Chart.PaneWidth(1) = 0
	with .Columns.Add("Names")
		.DisplayFilterButton = .T.
		.FilterType = 3
	endwith
	with .Items
		.AddItem("Mantel")
		.AddItem("Mechanik")
		.AddItem("Motor")
		.AddItem("Murks")
		.AddItem("Märchen")
		.AddItem("Möhren")
		.AddItem("Mühle")
		.AddItem("Sérigraphie")
	endwith
	.Columns.Item(0).Filter = "*ä*"
	.ApplyFilter
	.EndUpdate
endwith
|
|
888
|
Can I set the search box / filterbarprompt to invisible, so I can use my own input and *string* via VBA
with thisform.Gantt1
	.BeginUpdate
	.ColumnAutoResize = .T.
	.ContinueColumnScroll = 0
	.MarkSearchColumn = .F.
	.SearchColumnIndex = 1
	.FilterBarHeight = 0
	.FilterBarPromptVisible = .T. && .T.
	.Chart.PaneWidth(1) = 0
	with .Columns
		.Add("Name").Width = 96
		.Add("Title").Width = 96
		.Add("City")
	endwith
	with .Items
		h0 = .AddItem("Nancy Davolio")
		.CellCaption(h0,1) = "Sales Representative"
		.CellCaption(h0,2) = "Seattle"
		h0 = .AddItem("Andrew Fuller")
		.CellCaption(h0,1) = "Vice President, Sales"
		.CellCaption(h0,2) = "Tacoma"
		.SelectItem(h0) = .T.
		h0 = .AddItem("Janet Leverling")
		.CellCaption(h0,1) = "Sales Representative"
		.CellCaption(h0,2) = "Kirkland"
		h0 = .AddItem("Margaret Peacock")
		.CellCaption(h0,1) = "Sales Representative"
		.CellCaption(h0,2) = "Redmond"
		h0 = .AddItem("Steven Buchanan")
		.CellCaption(h0,1) = "Sales Manager"
		.CellCaption(h0,2) = "London"
		h0 = .AddItem("Michael Suyama")
		.CellCaption(h0,1) = "Sales Representative"
		.CellCaption(h0,2) = "London"
		h0 = .AddItem("Robert King")
		.CellCaption(h0,1) = "Sales Representative"
		.CellCaption(h0,2) = "London"
		h0 = .AddItem("Laura Callahan")
		.CellCaption(h0,1) = "Inside Sales Coordinator"
		.CellCaption(h0,2) = "Seattle"
		h0 = .AddItem("Anne Dodsworth")
		.CellCaption(h0,1) = "Sales Representative"
		.CellCaption(h0,2) = "London"
	endwith
	.FilterBarPromptPattern = "London"
	.EndUpdate
endwith
|
|
887
|
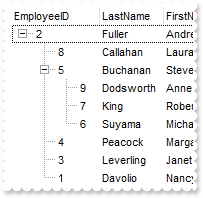
How to load a hierarchy using the control's DataSource property (Parent-ID-Relation)
*** AddItem event - Occurs after a new Item has been inserted to Items collection. ***
LPARAMETERS Item
	with thisform.Gantt1
		with .Items
			.SetParent(Item,.FindItem(.CellCaption(Item,"ReportsTo"),"EmployeeID"))
		endwith
	endwith

with thisform.Gantt1
	.BeginUpdate
	.Chart.PaneWidth(1) = 0
	.LinesAtRoot = -1
	.ColumnAutoResize = .F.
	.ContinueColumnScroll = .F.
	rs = CreateObject("ADOR.Recordset")
	with rs
		.Open("SELECT * FROM Employees ORDER BY ReportsTo","Provider=Microsoft.ACE.OLEDB.12.0;Data Source=C:\Program Files\Exontrol\ExGantt\Sample\Access\SAMPLE.MDB",3,3)
	endwith
	.DataSource = rs
	.Items.ExpandItem(0) = .T.
	.EndUpdate
endwith
|
|
886
|
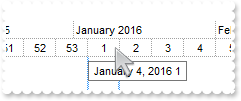
The week number is not correct. What can I do
with thisform.Gantt1
	with .Chart
		.FirstWeekDay = .LocFirstWeekDay && .LocFirstWeekDay
		.MonthNames = .LocMonthNames
		.WeekDays = .LocWeekDays
		.AMPM = .LocAMPM
		.LevelCount = 2
		.PaneWidth(0) = 0
		.UnitScale = 256
		.UnitWidth = 32
		.FirstVisibleDate = {^2016-1-1}
		.WeekNumberAs = 0
		.ScrollTo(.FirstVisibleDate,1)
	endwith
endwith
|
|
885
|
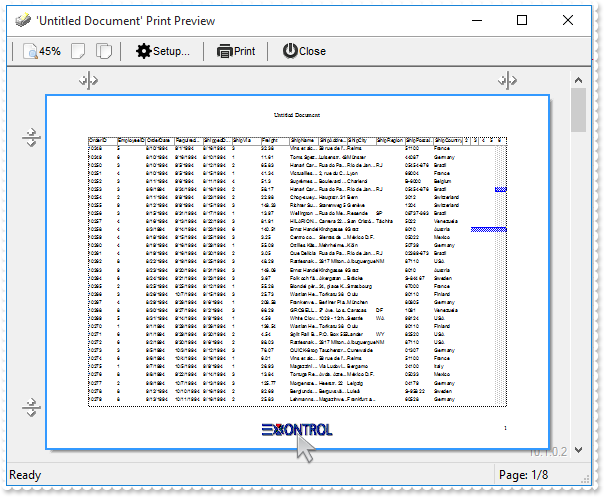
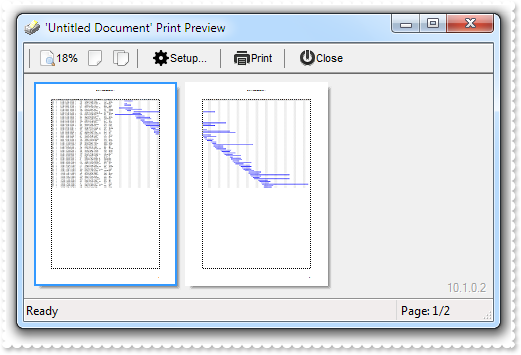
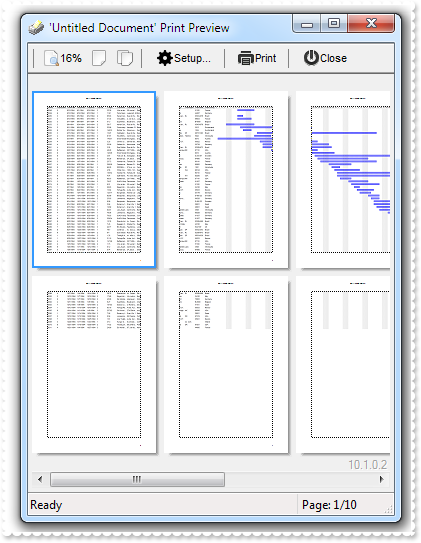
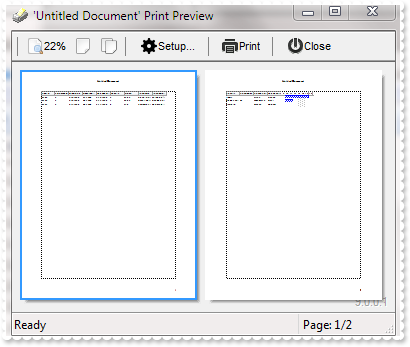
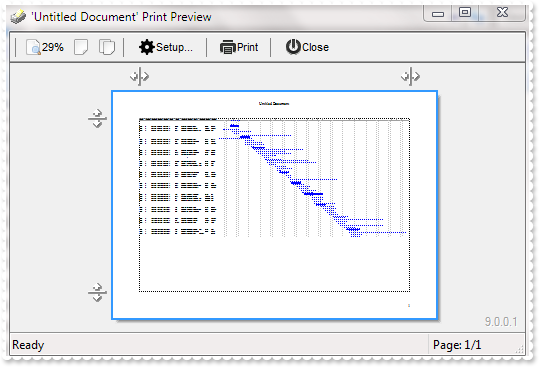
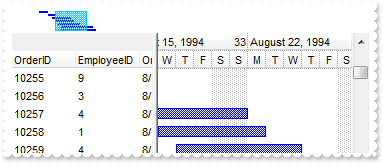
How can I display my logo on print/print-preview
*** AddItem event - Occurs after a new Item has been inserted to Items collection. ***
LPARAMETERS Item
	with thisform.Gantt1
		with .Items
			.AddBar(Item,"Task",.CellCaption(Item,2),.CellCaption(Item,4))
		endwith
	endwith

with thisform.Gantt1
	.BeginUpdate
	.ColumnAutoResize = .F.
	.ContinueColumnScroll = .F.
	rs = CreateObject("ADOR.Recordset")
	with rs
		.Open("Orders","Provider=Microsoft.ACE.OLEDB.12.0;Data Source=C:\Program Files\Exontrol\ExGantt\Sample\Access\sample.accdb",3,3)
	endwith
	.DataSource = rs
	.Chart.FirstVisibleDate = {^1994-8-4}
	.EndUpdate
	with CreateObject("Exontrol.Print")
		.PageOrientation = 2
		.HTMLPicture("logo") = "c:\exontrol\images\zipdisk.gif"
		.ExtraCaption("logo","<img>logo</img>",1,1)
		.PrintExt = thisform.Gantt1.Object
		.Preview
	endwith
endwith
|
|
884
|
How can I align captions of items with checkbox, with items with no checkbox
with thisform.Gantt1
	.BeginUpdate
	.Columns.Add("Default")
	with .Items
		.CellImages(.AddItem(0),0) = "1"
		.CellHasCheckBox(.AddItem(1),0) = .T.
		.CellImages(.AddItem(2),0) = "1"
	endwith
	.EndUpdate
endwith
|
|
883
|
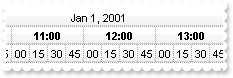
How do I show the chart's labels in 24-hour clock format
with thisform.Gantt1
	with .Chart
		.PaneWidth(0) = 0
		.FirstVisibleDate = {^2001-1-1}
		.LevelCount = 3
		with .Level(0)
			.Label = "<%mmm%> <%d%>, <%yyyy%>"
			.Alignment = 17 && AlignmentEnum.exHOutside Or AlignmentEnum.CenterAlignment
			.Unit = 4096
		endwith
		with .Level(1)
			.Label = "<b><%h%>:00</b>"
			.Alignment = 1
			.Unit = 65536
			.DrawTickLines = .T.
			.DrawGridLines = .T.
		endwith
		with .Level(2)
			.Label = "<%nn%>"
			.Unit = 1048576
			.Count = 15
		endwith
		.ScrollTo({^2001-1-1 8:30:00},0)
	endwith
endwith
|
|
882
|
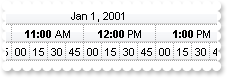
How do I show the chart's labels in 12-hour clock format
with thisform.Gantt1
	with .Chart
		.PaneWidth(0) = 0
		.FirstVisibleDate = {^2001-1-1}
		.LevelCount = 3
		with .Level(0)
			.Label = "<%mmm%> <%d%>, <%yyyy%>"
			.Alignment = 17 && AlignmentEnum.exHOutside Or AlignmentEnum.CenterAlignment
			.Unit = 4096
		endwith
		with .Level(1)
			.Label = "<b><%h%>:00</b> <%AM/PM%>"
			.Alignment = 1
			.Unit = 65536
			.DrawTickLines = .T.
			.DrawGridLines = .T.
		endwith
		with .Level(2)
			.Label = "<%nn%>"
			.Unit = 1048576
			.Count = 15
		endwith
		.ScrollTo({^2001-1-1 8:30:00},0)
	endwith
endwith
|
|
881
|
The control does not ensure the item to fit the control's client area once the user clicks the cell's button or check box. What can be done
*** MouseDown event - Occurs when the user presses a mouse button. ***
LPARAMETERS Button, Shift, X, Y
	*** Items.EnsureVisibleItem(ItemFromPoint(-1,-1,c,hit))

with thisform.Gantt1
	.BeginUpdate
	.TreeColumnIndex = -1
	.SelForeColor = .ForeColor
	with .Columns.Add("Buttons")
		.Alignment = 1
		.Def(2) = .T.
	endwith
	with .Items
		.AddItem("Button A")
		.AddItem("Button B")
		.AddItem("Button C")
	endwith
	.EndUpdate
endwith
|
|
880
|
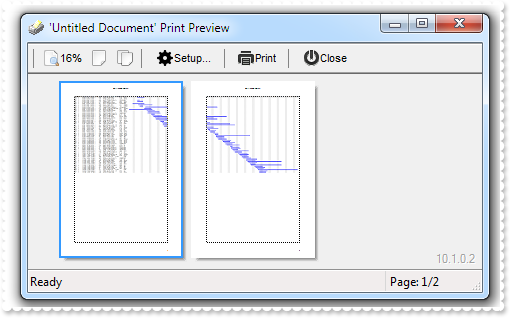
Do you have any Fit-To-Page options when printing the control (W x T, Fit-To )
*** AddItem event - Occurs after a new Item has been inserted to Items collection. ***
LPARAMETERS Item
	with thisform.Gantt1
		with .Items
			.AddBar(Item,"Task",.CellCaption(Item,2),.CellCaption(Item,4))
		endwith
	endwith

with thisform.Gantt1
	.BeginUpdate
	.ColumnAutoResize = .F.
	.ContinueColumnScroll = .F.
	rs = CreateObject("ADOR.Recordset")
	with rs
		.Open("Orders","Provider=Microsoft.ACE.OLEDB.12.0;Data Source=C:\Program Files\Exontrol\ExGantt\Sample\Access\sample.accdb",3,3)
	endwith
	.DataSource = rs
	.Chart.FirstVisibleDate = {^1994-8-4}
	.EndUpdate
	with CreateObject("Exontrol.Print")
		.Options = "FitToPage =1 x 2"
		.PrintExt = thisform.Gantt1.Object
		.Preview
	endwith
endwith
|
|
879
|
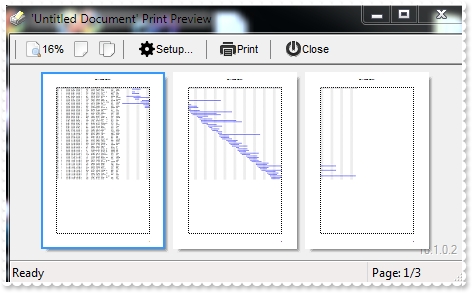
Do you have any Fit-To-Page options when printing the control ( x T, Fit-To Tall )
*** AddItem event - Occurs after a new Item has been inserted to Items collection. ***
LPARAMETERS Item
	with thisform.Gantt1
		with .Items
			.AddBar(Item,"Task",.CellCaption(Item,2),.CellCaption(Item,4))
		endwith
	endwith

with thisform.Gantt1
	.BeginUpdate
	.ColumnAutoResize = .F.
	.ContinueColumnScroll = .F.
	rs = CreateObject("ADOR.Recordset")
	with rs
		.Open("Orders","Provider=Microsoft.ACE.OLEDB.12.0;Data Source=C:\Program Files\Exontrol\ExGantt\Sample\Access\sample.accdb",3,3)
	endwith
	.DataSource = rs
	.Chart.FirstVisibleDate = {^1994-8-4}
	.EndUpdate
	with CreateObject("Exontrol.Print")
		.Options = "FitToPage = x 2"
		.PrintExt = thisform.Gantt1.Object
		.Preview
	endwith
endwith
|
|
878
|
Do you have any Fit-To-Page options when printing the control ( W x, Fit-To Wide )
*** AddItem event - Occurs after a new Item has been inserted to Items collection. ***
LPARAMETERS Item
	with thisform.Gantt1
		with .Items
			.AddBar(Item,"Task",.CellCaption(Item,2),.CellCaption(Item,4))
		endwith
	endwith

with thisform.Gantt1
	.BeginUpdate
	.ColumnAutoResize = .F.
	.ContinueColumnScroll = .F.
	rs = CreateObject("ADOR.Recordset")
	with rs
		.Open("Orders","Provider=Microsoft.ACE.OLEDB.12.0;Data Source=C:\Program Files\Exontrol\ExGantt\Sample\Access\sample.accdb",3,3)
	endwith
	.DataSource = rs
	.Chart.FirstVisibleDate = {^1994-8-4}
	.EndUpdate
	with CreateObject("Exontrol.Print")
		.Options = "FitToPage = 2 x"
		.PrintExt = thisform.Gantt1.Object
		.Preview
	endwith
endwith
|
|
877
|
Do you have any Fit-To-Page options when printing the control ( percent view, Adjust-To )
*** AddItem event - Occurs after a new Item has been inserted to Items collection. ***
LPARAMETERS Item
	with thisform.Gantt1
		with .Items
			.AddBar(Item,"Task",.CellCaption(Item,2),.CellCaption(Item,4))
		endwith
	endwith

with thisform.Gantt1
	.BeginUpdate
	.ColumnAutoResize = .F.
	.ContinueColumnScroll = .F.
	rs = CreateObject("ADOR.Recordset")
	with rs
		.Open("Orders","Provider=Microsoft.ACE.OLEDB.12.0;Data Source=C:\Program Files\Exontrol\ExGantt\Sample\Access\sample.accdb",3,3)
	endwith
	.DataSource = rs
	.Chart.FirstVisibleDate = {^1994-8-4}
	.EndUpdate
	with CreateObject("Exontrol.Print")
		.Options = "FitToPage = 50%"
		.PrintExt = thisform.Gantt1.Object
		.Preview
	endwith
endwith
|
|
876
|
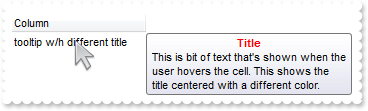
Does the title of the cell's tooltip supports HTML format
with thisform.Gantt1
	.BeginUpdate
	.Chart.PaneWidth(1) = 0
	with .Columns.Add("")
		.Caption = ""
		.HTMLCaption = "Column"
	endwith
	with .Items
		var_s = "<c><b><fgcolor=FF0000>Title</fgcolor></b><br>This is bit of text that's shown when the user hovers the cell. This shows the titl"
		var_s = var_s + "e centered with a different color."
		.CellToolTip(.AddItem("tooltip w/h different title"),0) = var_s
	endwith
	.EndUpdate
endwith
|
|
875
|
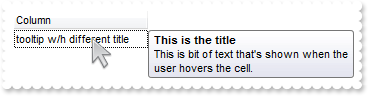
How do I specify a different title for the cell's tooltip
with thisform.Gantt1
.BeginUpdate
.Chart.PaneWidth(1) = 0
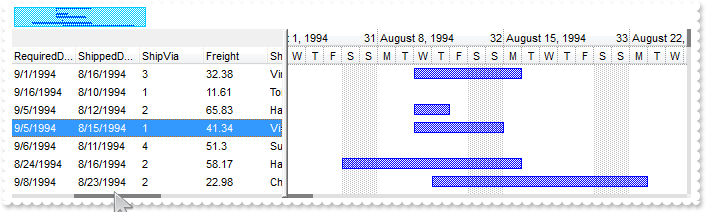
with .Columns.Add("")
.Caption = "This is the title"
.HTMLCaption = "Column"
endwith
with .Items
.CellToolTip(.AddItem("tooltip w/h different title"),0) = "This is bit of text that's shown when the user hovers the cell."
endwith
.EndUpdate
endwith
|
|
874
|
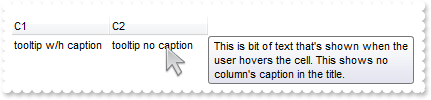
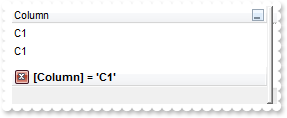
The cell's tooltip displays the column's caption in its title. How can I get ride of that
with thisform.Gantt1
	.BeginUpdate
	.Chart.PaneWidth(1) = 0
	with .Columns
		.Add("C1")
		.Add("C2")
	endwith
	with .Items
		h = .AddItem("tooltip w/h caption")
		.CellToolTip(h,0) = "This is bit of text that's shown when the user hovers the cell. This shows the column's caption in the title."
		.CellCaption(h,1) = "tooltip no caption"
		.CellToolTip(h,1) = "This is bit of text that's shown when the user hovers the cell. This shows no column's caption in the title."
	endwith
	with .Columns.Item("C2")
		.HTMLCaption = .Caption
		.Caption = ""
	endwith
	.EndUpdate
endwith
|
|
873
|
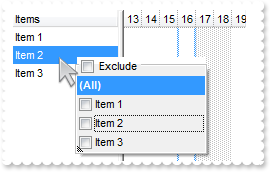
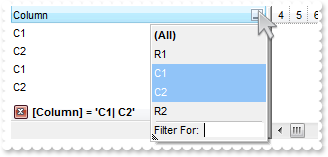
How can I programmatically show the column's filter
*** RClick event - Fired when right mouse button is clicked ***
LPARAMETERS nop
	with thisform.Gantt1
		i = .ItemFromPoint(-1,-1,c,hit)
		.Columns.Item(c).ShowFilter("-1,-1,128,128")
	endwith

with thisform.Gantt1
	.BeginUpdate
	.ShowFocusRect = .F.
	with .Columns.Add("Items ")
		.DisplayFilterPattern = .F.
		.FilterList = 9472 && FilterListEnum.exShowExclude Or FilterListEnum.exShowFocusItem Or FilterListEnum.exShowCheckBox
	endwith
	with .Items
		.AddItem("Item 1")
		.AddItem("Item 2")
		.AddItem("Item 3")
	endwith
	.EndUpdate
endwith
|
|
872
|
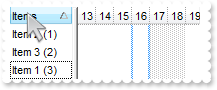
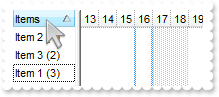
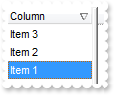
I want to be able to click on one of the headers, and sort by other column. How can I do that (method 2)
*** ColumnClick event - Fired after the user clicks on column's header. ***
LPARAMETERS Column
	*** Column.SortOrder = 1
	with thisform.Gantt1
		.SortOnClick = -1
		.Columns.Item("Sort").SortOrder = 1
		.SortOnClick = 1
	endwith

with thisform.Gantt1
	.BeginUpdate
	.MarkSearchColumn = .F.
	.SortOnClick = 1
	.Columns.Add("Items")
	.Columns.Add("Sort").Visible = .F.
	with .Items
		.CellCaption(.AddItem("Item 1 (3)"),1) = 3
		.CellCaption(.AddItem("Item 2 (1)"),1) = 1
		.CellCaption(.AddItem("Item 3 (2)"),1) = 2
	endwith
	.EndUpdate
endwith
|
|
871
|
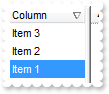
I want to be able to click on one of the headers, and sort by other column. How can I do that (method 1)
*** ColumnClick event - Fired after the user clicks on column's header. ***
LPARAMETERS Column
	*** Column.SortOrder = 1
	with thisform.Gantt1
		.Items.SortChildren(0,"Sort",.T.)
	endwith

with thisform.Gantt1
	.BeginUpdate
	.MarkSearchColumn = .F.
	.SortOnClick = 1
	.Columns.Add("Items")
	.Columns.Add("Sort").Visible = .F.
	with .Items
		.CellCaption(.AddItem("Item 1 (3)"),1) = 3
		.CellCaption(.AddItem("Item 2 (1)"),1) = 1
		.CellCaption(.AddItem("Item 3 (2)"),1) = 2
	endwith
	.EndUpdate
endwith
|
|
870
|
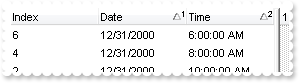
How can I sort by two-columns, one by date and one by time
with thisform.Gantt1
	.BeginUpdate
	.SingleSort = .F.
	with .Columns
		.Add("Index").FormatColumn = "1 index ``"
		.Add("Date").SortType = 2
		with .Add("Time")
			.SortType = 4
			.FormatColumn = "time(value)"
		endwith
	endwith
	with .Items
		h = .AddItem(0)
		.CellCaption(h,1) = {^2001-1-1}
		.CellCaption(h,2) = {^2001-1-1 10:00:00}
		h = .AddItem(0)
		.CellCaption(h,1) = {^2000-12-31}
		.CellCaption(h,2) = {^2001-1-1 10:00:00}
		h = .AddItem(0)
		.CellCaption(h,1) = {^2001-1-1}
		.CellCaption(h,2) = {^2001-1-1 6:00:00}
		h = .AddItem(0)
		.CellCaption(h,1) = {^2000-12-31}
		.CellCaption(h,2) = {^2001-1-1 8:00:00}
		h = .AddItem(0)
		.CellCaption(h,1) = {^2001-1-1}
		.CellCaption(h,2) = {^2001-1-1 8:00:00}
		h = .AddItem(0)
		.CellCaption(h,1) = {^2000-12-31}
		.CellCaption(h,2) = {^2001-1-1 6:00:00}
	endwith
	.Layout = "multiplesort="+chr(34)+"C1:1 C2:1"+chr(34)+""
	.EndUpdate
endwith
|
|
869
|
How can I connect to a DBF file
with thisform.Gantt1
	.BeginUpdate
	.ColumnAutoResize = .F.
	.ContinueColumnScroll = .F.
	rs = CreateObject("ADODB.Recordset")
	with rs
		.Open("Select * From foxcode.DBF","Provider=vfpoledb;Data Source=C:\Program Files\Microsoft Visual FoxPro 9\",3,3)
	endwith
	.DataSource = rs
	.Chart.PaneWidth(1) = 0
	.EndUpdate
endwith
|
|
868
|
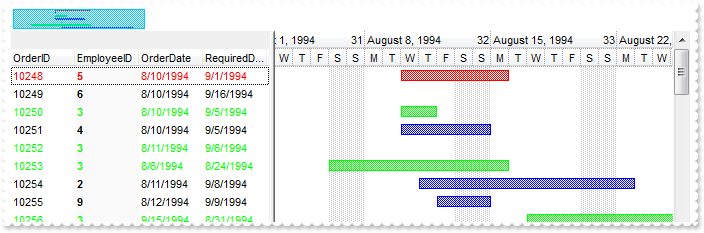
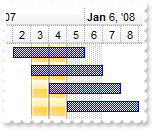
How can I change the bar's color based on values on the columns
*** AddItem event - Occurs after a new Item has been inserted to Items collection. ***
LPARAMETERS Item
	with thisform.Gantt1
		with .Items
			.AddBar(Item,"Task",.CellCaption(Item,2),.CellCaption(Item,4))
		endwith
	endwith

with thisform.Gantt1
	.BeginUpdate
	with .Chart
		.FirstVisibleDate = {^1994-8-3}
		.PaneWidth(0) = 256
		.LevelCount = 2
		.UnitScale = 4096
		.FirstWeekDay = 1
		.OverviewVisible = -1
	endwith
	.ColumnAutoResize = .F.
	.ContinueColumnScroll = .F.
	rs = CreateObject("ADOR.Recordset")
	with rs
		.Open("Orders","Provider=Microsoft.ACE.OLEDB.12.0;Data Source=C:\Program Files\Exontrol\ExGantt\Sample\Access\sample.accdb",3,3)
	endwith
	.DataSource = rs
	with .ConditionalFormats
		with .Add("1")
			.ApplyTo = 1 && 0x1
			.Bold = .T.
			.BackColor = RGB(250,250,250)
		endwith
		with .Add("%1 = 5")
			.ApplyToBars = "Task"
			.BarColor = RGB(255,0,0)
			.ForeColor = RGB(255,0,0)
			.BarOverviewColor = RGB(255,0,0)
		endwith
		with .Add("%1 = 3")
			.ApplyToBars = "Task"
			.BarColor = RGB(0,255,0)
			.ForeColor = RGB(0,255,0)
			.BarOverviewColor = RGB(0,255,0)
		endwith
	endwith
	.EndUpdate
endwith
|
|
867
|
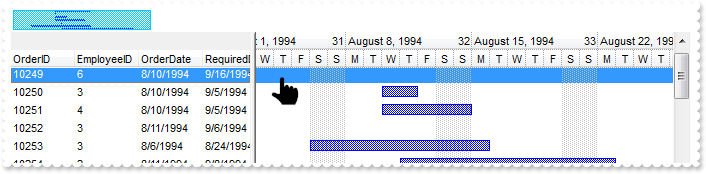
Does your control supports scrolling by touching the screen
*** AddItem event - Occurs after a new Item has been inserted to Items collection. ***
LPARAMETERS Item
	with thisform.Gantt1
		with .Items
			.AddBar(Item,"Task",.CellCaption(Item,2),.CellCaption(Item,4))
		endwith
	endwith

with thisform.Gantt1
	.BeginUpdate
	with .Chart
		.FirstVisibleDate = {^1994-8-3}
		.PaneWidth(0) = 256
		.LevelCount = 2
		.UnitScale = 4096
		.FirstWeekDay = 1
		.OverviewVisible = -1
	endwith
	.ColumnAutoResize = .F.
	.ContinueColumnScroll = .F.
	rs = CreateObject("ADOR.Recordset")
	with rs
		.Open("Orders","Provider=Microsoft.ACE.OLEDB.12.0;Data Source=C:\Program Files\Exontrol\ExGantt\Sample\Access\sample.accdb",3,3)
	endwith
	.DataSource = rs
	.ContinueColumnScroll = .T.
	.ScrollBySingleLine = .T.
	.AutoDrag = 4112 && AutoDragEnum.exAutoDragScrollOnShortTouch Or AutoDragEnum.exAutoDragScroll
	.EndUpdate
endwith
|
|
866
|
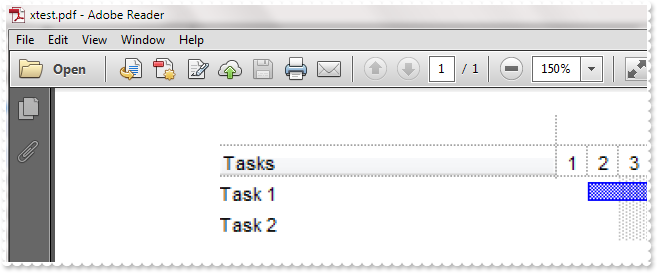
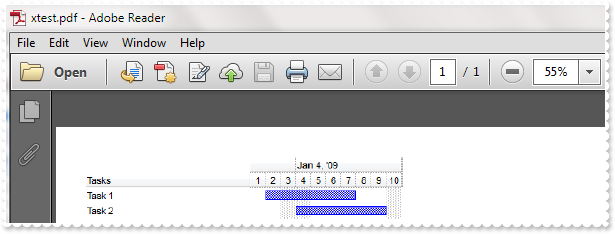
How can I export the control's content to a PDF document (method 1)
with thisform.Gantt1
	.BeginUpdate
	.MarkSearchColumn = .F.
	.Columns.Add("Tasks")
	with .Chart
		.PaneWidth(0) = 196
		.LevelCount = 2
		.ShowEmptyBars = 1
		.FirstVisibleDate = {^2009-1-1}
	endwith
	with .Items
		.AddBar(.AddItem("Task 1"),"Task",{^2009-1-2},{^2009-1-7})
		.AddBar(.AddItem("Task 2"),"Task",{^2009-1-4},{^2009-1-9})
	endwith
	with CreateObject("Exontrol.Print")
		.PrintExt = thisform.Gantt1.Object
		.CopyTo("c:/temp/xtest.pdf")
	endwith
	DEBUGOUT( "Look for C:\Temp\xtest.pdf file." )
	.EndUpdate
endwith
|
|
865
|
How can I export the control's content to a PDF document (method 2)
with thisform.Gantt1
	.BeginUpdate
	.MarkSearchColumn = .F.
	.Columns.Add("Tasks")
	with .Chart
		.PaneWidth(0) = 196
		.LevelCount = 2
		.ShowEmptyBars = 1
		.FirstVisibleDate = {^2009-1-1}
	endwith
	with .Items
		.AddBar(.AddItem("Task 1"),"Task",{^2009-1-2},{^2009-1-7})
		.AddBar(.AddItem("Task 2"),"Task",{^2009-1-4},{^2009-1-9})
	endwith
	var_CopyTo = .CopyTo("c:/temp/xtest.pdf")
	DEBUGOUT( "Look for C:\Temp\xtest.pdf file." )
	.EndUpdate
endwith
|
|
864
|
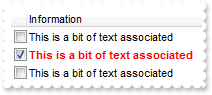
Is there a syntax for conditional formatting of items, based on CellState/CellStateChange
*** CellStateChanged event - Fired after cell's state has been changed. ***
LPARAMETERS Item, ColIndex
	with thisform.Gantt1
		with .Items
			.CellCaption(Item,2) = .CellState(Item,0)
		endwith
	endwith

with thisform.Gantt1
	.BeginUpdate
	.ShowFocusRect = .F.
	.SelBackMode = 1
	var_ConditionalFormat = .ConditionalFormats.Add("%2 != 0")
	with var_ConditionalFormat
		.Bold = .T.
		.ForeColor = RGB(255,0,0)
		.ApplyTo = -1
	endwith
	with .Columns.Add("")
		.Def(0) = .T.
		.Width = 16
		.AllowSizing = .F.
	endwith
	.Columns.Add("Information")
	.Columns.Add("Hidden").Visible = .F.
	with .Items
		.CellCaption(.AddItem(""),1) = "This is a bit of text associated"
		h = .AddItem("")
		.CellCaption(h,1) = "This is a bit of text associated"
		.CellState(h,0) = 1
		.CellCaption(.AddItem(""),1) = "This is a bit of text associated"
	endwith
	.EndUpdate
endwith
|
|
863
|
How can I use no scroll bars for touch-screens
*** AddItem event - Occurs after a new Item has been inserted to Items collection. ***
LPARAMETERS Item
	with thisform.Gantt1
		with .Items
			.AddBar(Item,"Task",.CellCaption(Item,2),.CellCaption(Item,4))
		endwith
	endwith

with thisform.Gantt1
	.BeginUpdate
	with .Chart
		.FirstVisibleDate = {^1994-8-3}
		.PaneWidth(0) = 256
		.LevelCount = 2
		.UnitScale = 4096
		.FirstWeekDay = 1
		.OverviewVisible = -1
	endwith
	.ColumnAutoResize = .F.
	.ContinueColumnScroll = .F.
	rs = CreateObject("ADOR.Recordset")
	with rs
		.Open("Orders","Provider=Microsoft.ACE.OLEDB.12.0;Data Source=C:\Program Files\Exontrol\ExGantt\Sample\Access\sample.accdb",3,3)
	endwith
	.DataSource = rs
	.AutoDrag = 16
	.ScrollWidth = 4
	.ScrollHeight = 4
	.Object.Background(384) = RGB(192,192,192)
	.Object.Background(392) = RGB(192,192,192)
	.Object.Background(404) = RGB(224,224,224)
	.Object.Background(388) = RGB(128,128,128)
	.Object.Background(276) = RGB(224,224,224)
	.Object.Background(264) = RGB(192,192,192)
	.Object.Background(260) = RGB(128,128,128)
	.Object.Background(256) = RGB(192,192,192)
	.ScrollButtonWidth = 0
	.ScrollButtonHeight = 0
	.EndUpdate
endwith
|
|
862
|
How can I print the selected items only
*** AddItem event - Occurs after a new Item has been inserted to Items collection. ***
LPARAMETERS Item
	with thisform.Gantt1
		with .Items
			.AddBar(Item,"Task",.CellCaption(Item,2),.CellCaption(Item,4))
		endwith
	endwith

with thisform.Gantt1
	.BeginUpdate
	.SingleSel = .F.
	.ColumnAutoResize = .F.
	.ContinueColumnScroll = .F.
	rs = CreateObject("ADOR.Recordset")
	with rs
		.Open("Orders","Provider=Microsoft.ACE.OLEDB.12.0;Data Source=C:\Program Files\Exontrol\ExGantt\Sample\Access\sample.accdb",3,3)
	endwith
	.DataSource = rs
	.Chart.FirstVisibleDate = {^1994-8-4}
	with .Items
		.SelectItem(.ItemByIndex(0)) = .T.
		.SelectItem(.ItemByIndex(2)) = .T.
		.SelectItem(.ItemByIndex(4)) = .T.
	endwith
	.EndUpdate
	with CreateObject("Exontrol.Print")
		.Options = "Print = Selection"
		.PrintExt = thisform.Gantt1.Object
		.Preview
	endwith
endwith
|
|
861
|
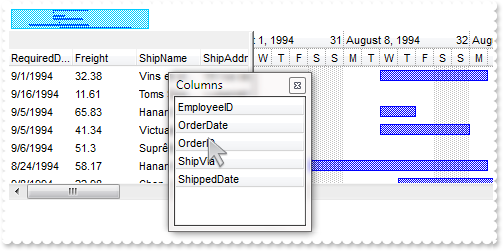
How can I sort the columns to be displayed on the columns floating bar
with thisform.Gantt1
	.ColumnAutoResize = .F.
	with .Columns
		.Add("City").Visible = .F.
		.Add("Start").Visible = .F.
		.Add("End").Visible = .F.
	endwith
	.ColumnsFloatBarVisible = .T.
	.ColumnsFloatBarSortOrder = 1
endwith
|
|
860
|
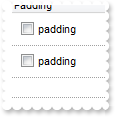
How can I add a vertical padding
with thisform.Gantt1
	.BeginUpdate
	.DrawGridLines = -1
	with .Columns.Add("Padding")
		.Def(0) = .T.
		.Def(16) = .F.
		.Def(48) = 6
		.Def(49) = 6
		.Def(50) = 6
		.Def(51) = 6
	endwith
	with .Items
		.AddItem("padding")
		.AddItem("padding")
	endwith
	.EndUpdate
endwith
|
|
859
|
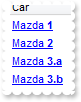
How do you embed HTML options into the anchor click string
*** AnchorClick event - Occurs when an anchor element is clicked. ***
LPARAMETERS AnchorID, Options
	with thisform.Gantt1
		DEBUGOUT( AnchorID )
		DEBUGOUT( Options )
	endwith

with thisform.Gantt1
	.BeginUpdate
	with .Columns
		.Add("Car").Def(17) = 1
	endwith
	with .Items
		.AddItem("<a mazda_1;options for 1>Mazda <b>1</b></a>")
		.AddItem("<a mazda_2;options for 2>Mazda <b>2</b></a>")
		.AddItem("<a mazda_3;options for 3a>Mazda <b>3.a</b></a>")
		.AddItem("<a mazda_3;options for 3b>Mazda <b>3.b</b></a>")
	endwith
	.EndUpdate
endwith
|
|
858
|
I have the rows with different background color, and when I select the item it takes the color of the SelBackColor, and therefore is no longer visible behind the color. Is there any option to make the item's color being visible (method 3)

with thisform.Gantt1
	.BeginUpdate
	var_s = "gBFLBCJwBAEHhEJAEGg4BVEIQAAYAQGKIYBkAKBQAGaAoDDMOQwQwAAxjGKEEwsACEIrjKCRShyCYZRhGcTSBCIZBqEqSZLiEZRQCWIAzATGYBRfIUEgjBM6ExwG78eg"
	var_s = var_s + "BHp/ZpkACIJJAaRjHQdJxGKKMQB9DIhCZpeKhWgkKIJBzOEyBRC4ERBGqNGrsIgLEqWZpnWhaNpWXYTLyBN64LhuK46g53O6wLxvK6hEr2dJ/YBcIAOfghf4NQ7EMRxL"
	var_s = var_s + "C8Mw3BDvYDkOAABAIgI="
	.VisualAppearance.Add(1,var_s)
	.SelBackColor = 0x1fffffe
	.ShowFocusRect = .F.
	.Columns.Add("Items")
	with .Items
		.ItemBackColor(.AddItem("red")) = RGB(255,0,0)
		.ItemBackColor(.AddItem("blue")) = RGB(0,0,255)
		.ItemBackColor(.AddItem("green")) = RGB(0,255,0)
	endwith
	.EndUpdate
endwith
|
|
857
|
I have the rows with different background color, and when I select the item it takes the color of the SelBackColor, and therefore is no longer visible behind the color. Is there any option to make the item's color being visible (method 2)

with thisform.Gantt1
	.BeginUpdate
	.SelBackMode = 1
	.ShowFocusRect = .F.
	.Columns.Add("Items")
	with .Items
		.ItemBackColor(.AddItem("red")) = RGB(255,0,0)
		.ItemBackColor(.AddItem("blue")) = RGB(0,0,255)
		.ItemBackColor(.AddItem("green")) = RGB(0,255,0)
	endwith
	.EndUpdate
endwith
|
|
856
|
I have the rows with different background color, and when I select the item it takes the color of the SelBackColor, and therefore is no longer visible behind the color. Is there any option to make the item's color being visible (method 1)

with thisform.Gantt1
	.BeginUpdate
	.SelBackColor = .BackColor
	.SelForeColor = .ForeColor
	.ShowFocusRect = .T.
	.Columns.Add("Items")
	with .Items
		.ItemBackColor(.AddItem("red")) = RGB(255,0,0)
		.ItemBackColor(.AddItem("blue")) = RGB(0,0,255)
		.ItemBackColor(.AddItem("green")) = RGB(0,255,0)
	endwith
	.EndUpdate
endwith
|
|
855
|
Do you have any Fit-To-Page options when printing the control
*** AddItem event - Occurs after a new Item has been inserted to Items collection. ***
LPARAMETERS Item
	with thisform.Gantt1
		with .Items
			.AddBar(Item,"Task",.CellCaption(Item,2),.CellCaption(Item,4))
		endwith
	endwith

with thisform.Gantt1
	.BeginUpdate
	.ColumnAutoResize = .F.
	.ContinueColumnScroll = .F.
	rs = CreateObject("ADOR.Recordset")
	with rs
		.Open("Orders","Provider=Microsoft.ACE.OLEDB.12.0;Data Source=C:\Program Files\Exontrol\ExGantt\Sample\Access\sample.accdb",3,3)
	endwith
	.DataSource = rs
	.Chart.FirstVisibleDate = {^1994-8-4}
	.EndUpdate
	with CreateObject("Exontrol.Print")
		.Options = "FitToPage = On"
		.PrintExt = thisform.Gantt1.Object
		.Preview
	endwith
endwith
|
|
854
|
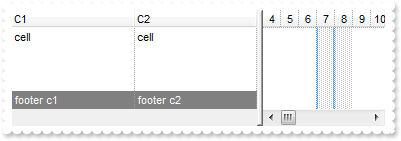
How can I add a footer row
with thisform.Gantt1
	.ShowLockedItems = .T.
	.DrawGridLines = 2
	.Columns.Add("C1")
	.Columns.Add("C2")
	with .Items
		.LockedItemCount(2) = 1
		h = .LockedItem(2,0)
		.ItemBackColor(h) = RGB(128,128,128)
		.ItemForeColor(h) = RGB(255,255,255)
		.CellCaption(h,0) = "footer c1"
		.CellCaption(h,1) = "footer c2"
		.CellCaption(.AddItem("cell"),1) = "cell"
	endwith
endwith
|
|
853
|
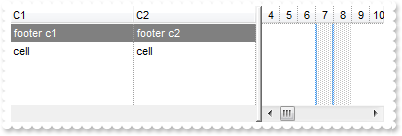
How can I add a header row
with thisform.Gantt1
	.ShowLockedItems = .T.
	.DrawGridLines = 2
	.Columns.Add("C1")
	.Columns.Add("C2")
	with .Items
		.LockedItemCount(0) = 1
		h = .LockedItem(0,0)
		.ItemBackColor(h) = RGB(128,128,128)
		.ItemForeColor(h) = RGB(255,255,255)
		.CellCaption(h,0) = "footer c1"
		.CellCaption(h,1) = "footer c2"
		.CellCaption(.AddItem("cell"),1) = "cell"
	endwith
endwith
|
|
852
|
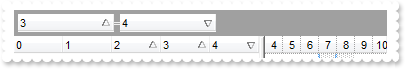
How can I programmatically add more columns to the sort bar and other to be sorted, but not included in the sort bar
with thisform.Gantt1
	.SortBarVisible = .T.
	with .Columns
		.Add(0)
		.Add(1)
		.Add(2)
		.Add(3)
		.Add(4)
	endwith
	.Layout = "multiplesort="+chr(34)+"C3:1 C4:2"+chr(34)+";singlesort="+chr(34)+"C2:1"+chr(34)+""
endwith
|
|
851
|
How can I fix a column, while other sizable and fill the control's client
with thisform.Gantt1
	.ColumnAutoResize = .T.
	.Columns.Add("Sizable")
	with .Columns.Add("F")
		.AllowSizing = .F.
		.Width = 16
	endwith
endwith
|
|
850
|
When I'm trying to show string with "line break" character (vbCrLF) in a textbox, it shows 2 squares. Is there any way to hide these squares

with thisform.Gantt1
	with .Columns
		.Add("Value")
		with .Add("CellSingleLine = False")
			.ComputedField = "%0"
			.Def(16) = .F.
		endwith
		with .Add("FormatColumn/replace CRLF")
			.ComputedField = "%0"
			.FormatColumn = "value replace `\r\n` with ``"
		endwith
		with .Add("FormatColumn/replace TAB,CRLF")
			.ComputedField = "%0"
			.FormatColumn = "(value replace `\t` with ``) replace `\r\n` with ``"
		endwith
	endwith
	with .Items
		.AddItem("a\ta\r\nb\tb")
	endwith
endwith
|
|
849
|
Is there any way to "unselect" radio group

*** DblClick event - Occurs when the user dblclk the left mouse button over an object. ***
LPARAMETERS Shift, X, Y
	with thisform.Gantt1
		with .Items
			h = .CellChecked(1234)
			.CellHasCheckBox(0,h) = .T.
			.CellState(0,h) = 0
			.CellHasCheckBox(0,h) = .F.
		endwith
	endwith

*** SelectionChanged event - Fired after a new item has been selected. ***
LPARAMETERS nop
	with thisform.Gantt1
		with .Items
			.CellState(.FocusItem,0) = 1
		endwith
	endwith

with thisform.Gantt1
	.MarkSearchColumn = .F.
	.SelBackColor = RGB(255,255,128)
	.SelForeColor = RGB(0,0,0)
	.Columns.Add("Default")
	with .Items
		h = .AddItem("Radio 1")
		.CellHasRadioButton(h,0) = .T.
		.CellRadioGroup(h,0) = 1234
		h = .AddItem("Radio 2")
		.CellHasRadioButton(h,0) = .T.
		.CellRadioGroup(h,0) = 1234
		.CellState(h,0) = 1
		h = .AddItem("Radio 3")
		.CellHasRadioButton(h,0) = .T.
		.CellRadioGroup(h,0) = 1234
	endwith
endwith
|
|
848
|
The Column.Alignment property does not seem to work for cells with images in them. What can be done
with thisform.Gantt1
	.BeginUpdate
	var_s = "gBJJgBAIDAAGAAEAAQhYAf8Pf4hh0QihCJo2AEZjQAjEZFEaIEaEEaAIAkcbk0olUrlktl0vmExmUzmk1m03nE5nU7nk9n0/oFBoVDolFo1HpFJpVLplNp1PqFRqVTql"
	var_s = var_s + "Vq1XrFZrVbrldr1fsFhsVjslls1ntFptVrtltt1vuFxuVzul1u13vF5vV7vl9v1/wGBwWDwmFw2HxGJxWLxmNx0xiFdyOTh8Tf9ZymXx+QytcyNgz8r0OblWjyWds+m0"
	var_s = var_s + "ka1Vf1ta1+r1mos2xrG2xeZ0+a0W0qOx3GO4NV3WeyvD2XJ5XL5nN51aiw+lfSj0gkUkAEllHanHI5j/cHg8EZf7w8vl8j4f/qfEZeB09/vjLAB30+kZQAP/P5/H6/yN"
	var_s = var_s + "AOAEAwCjMBwFAEDwJBMDwLBYAP2/8Hv8/gAGAD8LQs9w/nhDY/oygIA="
	.Images(var_s)
	.TreeColumnIndex = -1
	.DrawGridLines = -1
	.HeaderHeight = 24
	.DefaultItemHeight = 24
	with .Columns.Add("Image")
		.AllowSizing = .F.
		.Width = 32
		.HTMLCaption = "<img>1</img>"
		.HeaderAlignment = 1
		.Alignment = 1
		.Def(17) = 1
	endwith
	.Columns.Add("Rest")
	with .Items
		.AddItem("<img>1</img>")
		.AddItem("<img>2</img>")
		.AddItem("<img>3</img>")
	endwith
	.EndUpdate
endwith
|
|
847
|
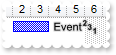
Does your control support subscript or superscript, in HTML captions
with thisform.Gantt1
	with .Chart
		.FirstVisibleDate = {^2001-1-1}
		.PaneWidth(0) = 64
	endwith
	.Columns.Add("Column")
	with .Items
		h = .AddItem("Item 1")
		.AddBar(h,"Task",{^2001-1-2},{^2001-1-4},"")
		.ItemBar(h,"",3) = "<sha ;;0>Event <b><font ;6><off -6>2<off 4>3<off 4>1"
		.ItemBar(h,"",4) = 18
	endwith
endwith
|
|
846
|
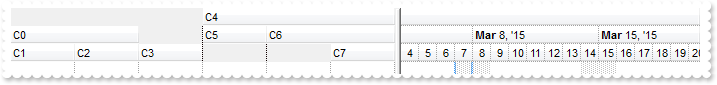
How do I arrange my columns on multiple levels
with thisform.Gantt1
	.BeginUpdate
	.ColumnAutoResize = .F.
	.DrawGridLines = -1
	with .Columns
		with .Add("C0")
			.ExpandColumns = "1,2"
			.DisplayExpandButton = .F.
		endwith
		.Add("C1")
		.Add("C2")
		.Add("C3")
		with .Add("C4")
			.ExpandColumns = "5,6"
			.DisplayExpandButton = .F.
		endwith
		.Add("C5")
		with .Add("C6")
			.ExpandColumns = "6,7"
			.DisplayExpandButton = .F.
		endwith
		.Add("C7")
	endwith
	.EndUpdate
endwith
|
|
845
|
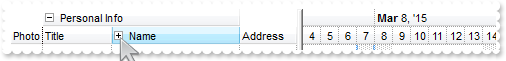
Does your control support expandable header or columns, so I can arrange it on multiple levels
with thisform.Gantt1
	.BeginUpdate
	.DrawGridLines = -1
	.BackColorLevelHeader = RGB(240,240,240)
	with .Columns
		with .Add("Photo")
			.AllowSizing = .F.
			.Width = 32
		endwith
		.Add("Personal Info")
		.Add("Title")
		.Add("Name")
		.Add("First")
		.Add("Last")
		.Add("Address")
		.Item("Personal Info").ExpandColumns = "2,3"
		with .Item("Name")
			.ExpandColumns = "4,5"
			.Expanded = .F.
		endwith
	endwith
	.EndUpdate
endwith
|
|
844
|
Can I change the format of date to be shown in the control

with thisform.Gantt1
	.Chart.PaneWidth(1) = 0
	with .Columns
		.Add("Default")
		with .Add("Format.1")
			.ComputedField = "%0"
			.FormatColumn = "dateF(value) replace `/` with `-`"
		endwith
		with .Add("Format.2")
			.ComputedField = "%0"
			.Def(17) = 1
			.FormatColumn = "`<b>`+ shortdate(value) + `</b> ` + timeF(value)"
		endwith
		with .Add("Format.3")
			.ComputedField = "%0"
			.Def(17) = 1
			var_s = "` <b>`+ ( weekday(value) case ( 0 : `Su`; 1 : `Mo`; 2 : `Tu`; 3 : `We`; 4 : `Th`; 5 : `Fr`; 6 : `Sa`) ) + `</b> ` + ( dateF(valu"
			var_s = var_s + "e) replace `/` with `-` )"
			.FormatColumn = var_s
		endwith
	endwith
	with .Items
		.AddItem({^2001-1-1 10:00:00})
		.AddItem({^2001-1-2 10:00:00})
	endwith
endwith
|
|
843
|
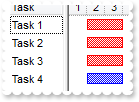
How can I remove all bars from the chart
with thisform.Gantt1
	.Columns.Add("Task")
	.Chart.FirstVisibleDate = {^2001-1-1}
	with .Items
		.AddBar(.AddItem("Task 1"),"Task",{^2001-1-2},{^2001-1-4},"K1")
		.AddBar(.AddItem("Task 2"),"Task",{^2001-1-2},{^2001-1-4},"K1")
		.AddBar(.AddItem("Task 3"),"Task",{^2001-1-2},{^2001-1-4},"K1")
		.AddBar(.AddItem("Task 4"),"Task",{^2001-1-2},{^2001-1-4},"K2")
		.ClearBars(0)
	endwith
endwith
|
|
842
|
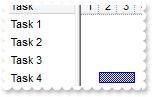
How can I change the color for all bars with a specified key
with thisform.Gantt1
	.Columns.Add("Task")
	.Chart.FirstVisibleDate = {^2001-1-1}
	with .Items
		.AddBar(.AddItem("Task 1"),"Task",{^2001-1-2},{^2001-1-4},"K1")
		.AddBar(.AddItem("Task 2"),"Task",{^2001-1-2},{^2001-1-4},"K1")
		.AddBar(.AddItem("Task 3"),"Task",{^2001-1-2},{^2001-1-4},"K1")
		.AddBar(.AddItem("Task 4"),"Task",{^2001-1-2},{^2001-1-4},"K2")
		.ItemBar(0,"K1",513) = 255
	endwith
endwith
|
|
841
|
Is there any automatic way to change a property for all bars with a specified key
with thisform.Gantt1
	.Columns.Add("Task")
	.Chart.FirstVisibleDate = {^2001-1-1}
	with .Items
		.AddBar(.AddItem("Task 1"),"Task",{^2001-1-2},{^2001-1-4},"K1")
		.AddBar(.AddItem("Task 2"),"Task",{^2001-1-2},{^2001-1-4},"K1")
		.AddBar(.AddItem("Task 3"),"Task",{^2001-1-2},{^2001-1-4},"K1")
		.AddBar(.AddItem("Task 4"),"Task",{^2001-1-2},{^2001-1-4},"K2")
		.ItemBar(0,"K1",513) = 255
	endwith
endwith
|
|
840
|
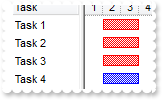
How can I remove all bars with specified key
with thisform.Gantt1
	.Columns.Add("Task")
	.Chart.FirstVisibleDate = {^2001-1-1}
	with .Items
		.AddBar(.AddItem("Task 1"),"Task",{^2001-1-2},{^2001-1-4},"K1")
		.AddBar(.AddItem("Task 2"),"Task",{^2001-1-2},{^2001-1-4},"K1")
		.AddBar(.AddItem("Task 3"),"Task",{^2001-1-2},{^2001-1-4},"K1")
		.AddBar(.AddItem("Task 4"),"Task",{^2001-1-2},{^2001-1-4},"K2")
		.RemoveBar(0,"K1")
	endwith
endwith
|
|
839
|
How can I find if there is any filter applied to the control
*** FilterChange event - Occurs when the filter was changed. ***
LPARAMETERS nop
	with thisform.Gantt1
		DEBUGOUT( "If negative, the filter is present, else not" )
		DEBUGOUT( .Items.VisibleItemCount )
	endwith

with thisform.Gantt1
	.BeginUpdate
	.LinesAtRoot = -1
	.TreeColumnIndex = -1
	.FilterInclude = 4
	with .Columns.Add("Column")
		.DisplayFilterButton = .T.
		.FilterType = 240
		.Filter = "C1"
	endwith
	with .Items
		h = .AddItem("R1")
		.InsertItem(h,Null,"C1")
		.InsertItem(h,Null,"C2")
		.ExpandItem(h) = .T.
		h = .AddItem("R2")
		.InsertItem(h,Null,"C1")
		.InsertItem(h,Null,"C2")
	endwith
	.ApplyFilter
	.EndUpdate
endwith
|
|
838
|
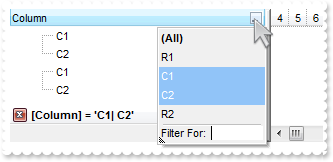
How can I prevent showing the lines for the hierarchy while using the exMatchingItemsOnly option
with thisform.Gantt1
	.BeginUpdate
	.LinesAtRoot = -1
	.TreeColumnIndex = -1
	.FilterInclude = 4
	with .Columns.Add("Column")
		.DisplayFilterButton = .T.
		.FilterType = 240
		.Filter = "C1|C2"
	endwith
	with .Items
		h = .AddItem("R1")
		.InsertItem(h,Null,"C1")
		.InsertItem(h,Null,"C2")
		.ExpandItem(h) = .T.
		h = .AddItem("R2")
		.InsertItem(h,Null,"C1")
		.InsertItem(h,Null,"C2")
	endwith
	.ApplyFilter
	.EndUpdate
endwith
|
|
837
|
Is there any method to get only the matched items and not the items with his parent
with thisform.Gantt1
	.BeginUpdate
	.LinesAtRoot = -1
	.FilterInclude = 4
	with .Columns.Add("Column")
		.DisplayFilterButton = .T.
		.FilterType = 240
		.Filter = "C1|C2"
	endwith
	with .Items
		h = .AddItem("R1")
		.InsertItem(h,Null,"C1")
		.InsertItem(h,Null,"C2")
		.ExpandItem(h) = .T.
		h = .AddItem("R2")
		.InsertItem(h,Null,"C1")
		.InsertItem(h,Null,"C2")
	endwith
	.ApplyFilter
	.EndUpdate
endwith
|
|
836
|
Is there any property I can save and restore automatically the current setting, column position, size, and so on (2)
with thisform.Gantt1
	.BeginUpdate
	.Columns.Add("Column")
	with .Items
		.AddItem("Item 1")
		.AddItem("Item 2")
		.AddItem("Item 3")
	endwith
	.Layout = "Select="+chr(34)+"0"+chr(34)+";SingleSort="+chr(34)+"C0:2"+chr(34)+";Columns=1"
	.EndUpdate
endwith
|
|
835
|
Is there any property I can save and restore automatically the current setting, column position, size, and so on (1)
with thisform.Gantt1
	.BeginUpdate
	.Columns.Add("Column")
	with .Items
		.AddItem("Item 1")
		.AddItem("Item 2")
		.AddItem("Item 3")
	endwith
	var_s = "gBjAAwAAuABmABpABsAB0ABlAByhoAPIAOEPAA9gYABoABQAgUEg0XN4AOcJicKkpujMbjsfkMFk0YhkQgUOjUEl8gjcGO0ok8KMULjEaGMcj08kQAO8oMkTNEtGwAGQ"
	var_s = var_s + "Aqc7gUlhh1ABtAEsk9GpEfhElgVcsMupNlnlonlaAFcr0shUsp8QPEtnVJqJhmcIhUMh0QiU5sYAqMngUSuEMw07k8Qv0SgVRrNEuVflF2jF5x9JyNEm0TjQijemyE0j"
	var_s = var_s + "E3t+YruauoAu4Az1qj9BzRn0UzksSnAA0xDjY6qnAw8OiUQ0dwzN0zWz2t7j8/xURAGNvWH6k8xlEhklhEI0O/6QAgI="
	.Layout = var_s
	.EndUpdate
endwith
|
|
834
|
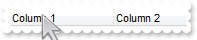
I have noticed that the column's header is changed once the cursor hovers it. Is it possible to change that visual appearance
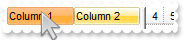
with thisform.Gantt1
	.VisualAppearance.Add(1,"c:\exontrol\images\normal.ebn")
	with .Columns
		.Add("Column 1")
		.Add("Column 2")
	endwith
	.BackColorHeader = 0x1000000
	.Object.Background(32) = 0x12d86ff
endwith
|
|
833
|
Is it possible to change the visual appearance of the columns selector/floating bar(3)
with thisform.Gantt1
	.ColumnAutoResize = .F.
	with .Columns
		.Add("Column 1")
		.Add("Column 2").Visible = .F.
	endwith
	.VisualAppearance.Add(2,"c:\exontrol\images\normal.ebn")
	.VisualAppearance.Add(3,"c:\exontrol\images\pushed.ebn")
	.Object.Background(92) = 0x2000000
	.Object.Background(87) = 0x3000000
	.Object.Background(93) = RGB(246,245,240)
	.ColumnsFloatBarVisible = .T.
endwith
|
|
832
|
Is it possible to change the visual appearance of the columns selector/floating bar(2)
with thisform.Gantt1
	.ColumnAutoResize = .F.
	with .Columns
		.Add("Column 1")
		.Add("Column 2").Visible = .F.
	endwith
	.VisualAppearance.Add(3,"c:\exontrol\images\pushed.ebn")
	.Object.Background(87) = 0x3000000
	.ColumnsFloatBarVisible = .T.
endwith
|
|
831
|
Is it possible to change the visual appearance of the columns selector/floating bar(1)
with thisform.Gantt1
	.VisualAppearance.Add(2,"c:\exontrol\images\normal.ebn")
	.Object.Background(92) = 0x2000000
	.Object.Background(87) = RGB(246,245,240)
	.Object.Background(93) = RGB(246,245,240)
	.ColumnsFloatBarVisible = .T.
endwith
|
|
830
|
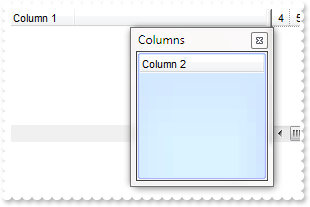
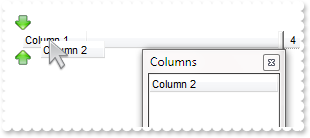
I am using the ColumnsFloatBarVisible property on True, but still not able to add any column on that list
with thisform.Gantt1
	.ColumnAutoResize = .F.
	with .Columns
		.Add("Column 1")
		.Add("Column 2").Visible = .F.
	endwith
	.ColumnsFloatBarVisible = .T.
endwith
|
|
829
|
Is it possible to list a column to columns selector/floating bar, but still user can use it
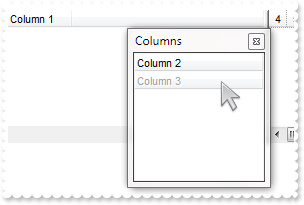
with thisform.Gantt1
	.ColumnAutoResize = .F.
	with .Columns
		.Add("Column 1")
		.Add("Column 2").Visible = .F.
		with .Add("Column 3")
			.Visible = .F.
			.Enabled = .F.
		endwith
	endwith
	.ColumnsFloatBarVisible = .T.
endwith
|
|
828
|
How can I prevent a specific column not to be listed in the columns selector/floating bar
with thisform.Gantt1
	.ColumnAutoResize = .F.
	with .Columns
		.Add("Column 1")
		.Add("Column 2").Visible = .F.
		with .Add("Column 3")
			.Visible = .F.
			.AllowDragging = .F.
		endwith
	endwith
	.ColumnsFloatBarVisible = .T.
endwith
|
|
827
|
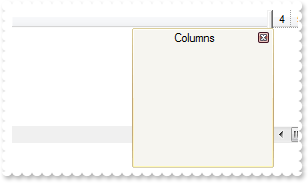
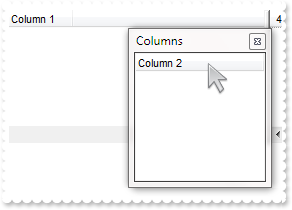
Is it possible to change the "Columns" caption being shown in the columns selector/floating bar
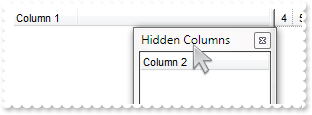
with thisform.Gantt1
	.ColumnAutoResize = .F.
	with .Columns
		.Add("Column 1")
		.Add("Column 2").Visible = .F.
	endwith
	.Object.Description(26) = "Hidden Columns"
	.ColumnsFloatBarVisible = .T.
endwith
|
|
826
|
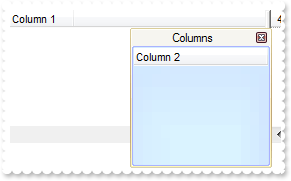
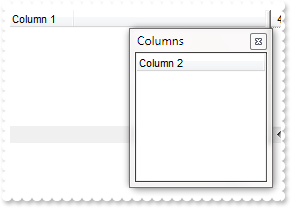
How can I show the columns selector, so the user can drag and drop columns to the view
with thisform.Gantt1
	.ColumnAutoResize = .F.
	with .Columns
		.Add("Column 1")
		.Add("Column 2").Visible = .F.
	endwith
	.ColumnsFloatBarVisible = .T.
endwith
|
|
825
|
The column's header is changed while the cursor hovers it. Is it possible to prevent that
with thisform.Gantt1
	with .Columns
		.Add("Column 1")
		.Add("Column 2")
	endwith
	.Object.Background(32) = -1
endwith
|
|
824
|
How do I enable the scrollbar-extension, as thumb to be shown outside of the control's client area
with thisform.Gantt1
	.BeginUpdate
	.ScrollBars = 15
	.Chart.ToolTip = ""
	.Object.ScrollPartVisible(0,65536) = .T.
	.Object.ScrollPartVisible(1,65536) = .T.
	.Object.ScrollPartVisible(2,65536) = .T.
	.ScrollWidth = 4
	.Object.Background(276) = RGB(240,240,240)
	.Object.Background(260) = RGB(128,128,128)
	.ScrollHeight = 4
	.Object.Background(404) = .Background(276)
	.Object.Background(388) = .Background(260)
	.Object.Background(511) = .Background(276)
	.EndUpdate
endwith
|
|
823
|
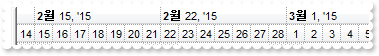
How can I display the Year in Thai, Buddhist, Korean format

with thisform.Gantt1
	with .Chart
		.FirstWeekDay = .LocFirstWeekDay && .LocFirstWeekDay
		.MonthNames = .LocMonthNames
		.WeekDays = .LocWeekDays
		.AMPM = .LocAMPM
		.LevelCount = 2
		.PaneWidth(0) = 0
		.UnitScale = 4096
		with .Level(0)
			.Label = "<%mmmm%> <%d%>, <%loc_yyyy%> <r><%ww%>"
			.Unit = 256
			.ToolTip = .Label
		endwith
		.ToolTip = "<%ddd%> <%m%>/<%d%>/<%loc_yyyy%>"
	endwith
	.Object.Description(17) = .Chart.MonthNames
endwith
|
|
822
|
How does localization work
with thisform.Gantt1
	with .Chart
		.FirstWeekDay = .LocFirstWeekDay && .LocFirstWeekDay
		.MonthNames = .LocMonthNames
		.WeekDays = .LocWeekDays
		.AMPM = .LocAMPM
		.LevelCount = 2
		.PaneWidth(0) = 0
	endwith
endwith
|
|
821
|
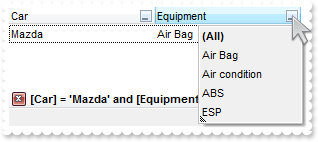
How can I have a case-insensitive filter (exFilterDoCaseSensitive flag is not set)
with thisform.Gantt1
	.BeginUpdate
	.Chart.PaneWidth(1) = 0
	.MarkSearchColumn = .F.
	with .Columns
		with .Add("Car")
			.DisplayFilterButton = .T.
			.FilterType = 240
			.Filter = "MAZDA"
		endwith
		with .Add("Equipment")
			.DisplayFilterButton = .T.
			.DisplayFilterPattern = .F.
			.CustomFilter = "Air Bag||*Air Bag*|||Air condition||*Air condition*|||ABS||*ABS*|||ESP||*ESP*"
			.FilterType = 3
			.Filter = "AIR BAG"
		endwith
	endwith
	with .Items
		.CellCaption(.AddItem("Mazda"),1) = "Air Bag"
		.CellCaption(.AddItem("Toyota"),1) = "Air Bag,Air condition"
		.CellCaption(.AddItem("Ford"),1) = "Air condition"
		.CellCaption(.AddItem("Nissan"),1) = "Air Bag,ABS,ESP"
		.CellCaption(.AddItem("Mazda"),1) = "Air Bag, ABS,ESP"
		.CellCaption(.AddItem("Mazda"),1) = "ABS,ESP"
	endwith
	.ApplyFilter
	.EndUpdate
endwith
|
|
820
|
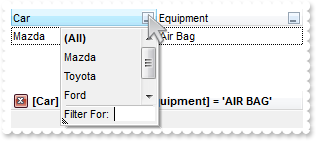
How can I have a case-sensitive filter
with thisform.Gantt1
	.BeginUpdate
	.Chart.PaneWidth(1) = 0
	.MarkSearchColumn = .F.
	with .Columns
		with .Add("Car")
			.DisplayFilterButton = .T.
			.FilterType = 496 && FilterTypeEnum.exFilterDoCaseSensitive Or FilterTypeEnum.exFilter
			.Filter = "Mazda"
		endwith
		with .Add("Equipment")
			.DisplayFilterButton = .T.
			.DisplayFilterPattern = .F.
			.CustomFilter = "Air Bag||*Air Bag*|||Air condition||*Air condition*|||ABS||*ABS*|||ESP||*ESP*"
			.FilterType = 259 && FilterTypeEnum.exFilterDoCaseSensitive Or FilterTypeEnum.exPattern
			.Filter = "Air Bag"
		endwith
	endwith
	with .Items
		.CellCaption(.AddItem("Mazda"),1) = "Air Bag"
		.CellCaption(.AddItem("Toyota"),1) = "Air Bag,Air condition"
		.CellCaption(.AddItem("Ford"),1) = "Air condition"
		.CellCaption(.AddItem("Nissan"),1) = "Air Bag,ABS,ESP"
		.CellCaption(.AddItem("Mazda"),1) = "Air Bag, ABS,ESP"
		.CellCaption(.AddItem("Mazda"),1) = "ABS,ESP"
	endwith
	.ApplyFilter
	.EndUpdate
endwith
|
|
819
|
I am using the FormatColumn/FormatCell to format my columns. Is it possible to ignore the SelForeColor, so the foreground color for selected items does not override my settings

*** SelectionChanged event - Fired after a new item has been selected. ***
LPARAMETERS nop
	with thisform.Gantt1
		with .Items
			.ClearItemBackColor(0)
			.ItemBackColor(.SelectedItem(0)) = RGB(128,255,255)
		endwith
	endwith

with thisform.Gantt1
	.BeginUpdate
	.MarkSearchColumn = .F.
	.SelForeColor = .ForeColor
	.SelBackColor = .BackColor
	.ShowFocusRect = .F.
	with .Columns
		with .Add("Format")
			var_s = "type(value) in (0,1) ? 'null' : ( dbl(value)<0 ? '<fgcolor=FF0000>'+ (value format '2|.|3|,|1' ) : (dbl(value)>0 ? '<fgcolor=000"
			var_s = var_s + "0FF>+'+(value format '2|.|3|,' ): '0.00') )"
			.FormatColumn = var_s
			.Def(17) = 1
		endwith
	endwith
	with .Items
		.AddItem(10)
		.AddItem(-8)
	endwith
	.EndUpdate
endwith
|
|
818
|
How do I hide the selection
with thisform.Gantt1
	.BeginUpdate
	.MarkSearchColumn = .F.
	.SelForeColor = .ForeColor
	.SelBackColor = .BackColor
	.ShowFocusRect = .F.
	with .Columns
		with .Add("Format")
			var_s = "type(value) in (0,1) ? 'null' : ( dbl(value)<0 ? '<fgcolor=FF0000>'+ (value format '2|.|3|,|1' ) : (dbl(value)>0 ? '<fgcolor=000"
			var_s = var_s + "0FF>+'+(value format '2|.|3|,' ): '0.00') )"
			.FormatColumn = var_s
			.Def(17) = 1
		endwith
	endwith
	with .Items
		.AddItem(10)
		.AddItem(-8)
	endwith
	.EndUpdate
endwith
|
|
817
|
How do I access the cells, or how do I get the values in the columns
with thisform.Gantt1
	with .Columns
		.Add("C1")
		.Add("C2")
		.Add("C3")
	endwith
	with .Items
		h = .AddItem("Item 1")
		.CellCaption(h,1) = "SubItem 1.1"
		.CellCaption(h,2) = "SubItem 1.2"
		DEBUGOUT( .CellCaption(h,2) )
	endwith
endwith
|
|
816
|
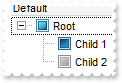
How can I change the check-boxes appearance
with thisform.Gantt1
	.LinesAtRoot = -1
	with .Columns.Add("Default")
		.Def(0) = .T.
		.PartialCheck = .T.
	endwith
	with .Items
		h = .AddItem("Root")
		.InsertItem(h,Null,"Child 1")
		.InsertItem(h,Null,"Child 2")
		.ExpandItem(h) = .T.
	endwith
	with .VisualAppearance
		.Add(1,"XP:Button 3 12")
		.Add(2,"XP:Button 3 11")
		.Add(3,"XP:Button 3 10")
	endwith
	.Object.CheckImage(0) = 16777216
	.Object.CheckImage(1) = 33554432
	.Object.CheckImage(2) = 50331648
endwith
|
|
815
|
How can I load my table from an Access 2007, using ADO
*** AddItem event - Occurs after a new Item has been inserted to Items collection. ***
LPARAMETERS Item
	with thisform.Gantt1
		with .Items
			.AddBar(Item,"Task",.CellCaption(Item,2),.CellCaption(Item,4))
		endwith
	endwith

with thisform.Gantt1
	.BeginUpdate
	with .Chart
		.FirstVisibleDate = {^1994-8-3}
		.PaneWidth(0) = 256
		.LevelCount = 2
		.UnitScale = 4096
		.FirstWeekDay = 1
		.OverviewVisible = -1
	endwith
	.ColumnAutoResize = .F.
	.ContinueColumnScroll = .F.
	rs = CreateObject("ADOR.Recordset")
	with rs
		.Open("Orders","Provider=Microsoft.ACE.OLEDB.12.0;Data Source=C:\Program Files\Exontrol\ExGantt\Sample\Access\sample.accdb",3,3)
	endwith
	.DataSource = rs
	.EndUpdate
endwith
|
|
814
|
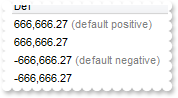
Is it possible display numbers in the same format no matter of regional settings in the control panel
with thisform.Gantt1
	.BeginUpdate
	.Columns.Add("Def").Def(17) = 1
	with .Items
		h = .AddItem(666666.27)
		.FormatCell(h,0) = "(value format '') +  ' <fgcolor=808080>(default positive)'"
		h = .AddItem(666666.27)
		.FormatCell(h,0) = "(value format '2|.|3|,|1|1')"
		h = .AddItem(-666666.27)
		.FormatCell(h,0) = "(value format '') +  ' <fgcolor=808080>(default negative)'"
		h = .AddItem(-666666.27)
		.FormatCell(h,0) = "(value format '2|.|3|,|1|1')"
	endwith
	.EndUpdate
endwith
|
|
813
|
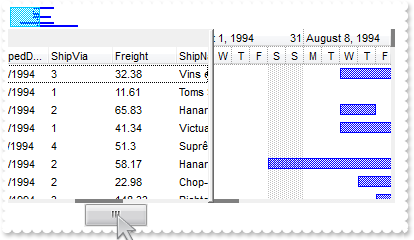
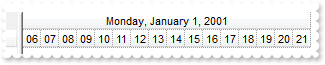
The right pane needs to show ONLY the hours 6am to 9pm (every hour) for one day only and the user should not to be able to scroll left or right nor see any other hours. How can I do that
with thisform.Gantt1
	.BeginUpdate
	.Columns.Add("Tasks")
	with .Chart
		.LevelCount = 2
		.ScrollRange(0) = {^2001-1-1}
		.ScrollRange(1) = {^2001-1-1}
		.UnitScale = 65536
		.NonworkingHours = 12582975
		.ShowNonworkingUnits = .F.
		.Level(0).Alignment = 17 && AlignmentEnum.exHOutside Or AlignmentEnum.CenterAlignment
		.UnitWidth = 18
		.PaneWidth(1) = 294
		.ScrollBar = .F.
	endwith
	.OnResizeControl = 128
	.EndUpdate
endwith
|
|
812
|
Can I use ebn files to display the selected dates
with thisform.Gantt1
	.BeginUpdate
	with .VisualAppearance
		.Add(2,"c:\exontrol\images\normal.ebn")
		.Add(1,"CP:2 0 -4 0 4")
	endwith
	with .Chart
		.FirstVisibleDate = {^2008-1-1}
		.MarkTodayColor = .BackColor
		.LevelCount = 2
		.MarkSelectDateColor = 0x1000000
		.SelectLevel = 1
		.SelectDate({^2008-1-3}) = .T.
		.SelectDate({^2008-1-4}) = .T.
	endwith
	.Columns.Add("Default")
	with .Items
		.AddBar(.AddItem("Item 1"),"Task",{^2008-1-2},{^2008-1-6})
		.AddBar(.AddItem("Item 2"),"Task",{^2008-1-3},{^2008-1-7})
		.AddBar(.AddItem("Item 3"),"Task",{^2008-1-4},{^2008-1-8})
		.AddBar(.AddItem("Item 4"),"Task",{^2008-1-5},{^2008-1-9})
	endwith
	.EndUpdate
endwith
|
|
811
|
Can I use ebn files to display the selected dates
with thisform.Gantt1
	.BeginUpdate
	.VisualAppearance.Add(1,"c:\exontrol\images\normal.ebn")
	with .Chart
		.FirstVisibleDate = {^2008-1-1}
		.MarkTodayColor = .BackColor
		.LevelCount = 2
		.MarkSelectDateColor = 0x1000000
		.SelectLevel = 1
		.SelectDate({^2008-1-3}) = .T.
	endwith
	.Columns.Add("Default")
	with .Items
		.AddBar(.AddItem("Item 1"),"Task",{^2008-1-2},{^2008-1-6})
		.AddBar(.AddItem("Item 2"),"Task",{^2008-1-3},{^2008-1-7})
		.AddBar(.AddItem("Item 3"),"Task",{^2008-1-4},{^2008-1-8})
	endwith
	.EndUpdate
endwith
|
|
810
|
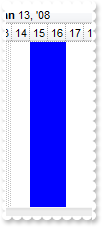
How can I change the color for selected dates to be solid
with thisform.Gantt1
	.BeginUpdate
	with .Chart
		.PaneWidth(0) = 0
		.FirstVisibleDate = {^2008-1-1}
		.MarkTodayColor = .BackColor
		.LevelCount = 2
		.MarkSelectDateColor = 0x7fff0000
		.SelectLevel = 1
		.SelectDate({^2008-1-15}) = .T.
		.SelectDate({^2008-1-16}) = .T.
	endwith
	.EndUpdate
endwith
|
|
809
|
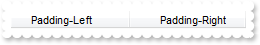
How can I add or change the padding (spaces) for captions in the control's header
with thisform.Gantt1
	.BeginUpdate
	.Chart.PaneWidth(1) = 0
	.Columns.Add("Padding-Left").Def(52) = 18
	with .Columns.Add("Padding-Right")
		.Def(53) = 18
		.HeaderAlignment = 2
	endwith
	.EndUpdate
endwith
|
|
808
|
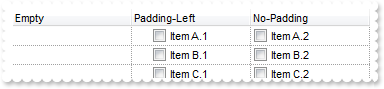
Do you have any plans to add cell spacing and cell padding to the cells
with thisform.Gantt1
	.BeginUpdate
	.Chart.PaneWidth(1) = 0
	.DrawGridLines = -1
	with .Columns.Add("Padding-Left")
		.Def(0) = .T.
		.Def(48) = 18
	endwith
	.Columns.Add("No-Padding").Def(0) = .T.
	.Columns.Add("Empty").Position = 0
	with .Items
		.CellCaption(.AddItem("Item A.1"),1) = "Item A.2"
		.CellCaption(.AddItem("Item B.1"),1) = "Item B.2"
		.CellCaption(.AddItem("Item C.1"),1) = "Item C.2"
	endwith
	.EndUpdate
endwith
|
|
807
|
Is it possible to display information about the firing events
*** Event event - Notifies the application once the control fires an event. ***
LPARAMETERS EventID
	with thisform.Gantt1
		DEBUGOUT( .EventParam(-2) )
	endwith
|
|
806
|
Is it possible to scroll the control's content by clicking and moving the mouse up or down
*** AddItem event - Occurs after a new Item has been inserted to Items collection. ***
LPARAMETERS Item
	with thisform.Gantt1
		with .Items
			.AddBar(Item,"Task",.CellCaption(Item,2),.CellCaption(Item,4))
		endwith
	endwith

with thisform.Gantt1
	.BeginUpdate
	with .Chart
		.FirstVisibleDate = {^1994-8-3}
		.PaneWidth(0) = 256
		.LevelCount = 2
		.UnitScale = 4096
		.FirstWeekDay = 1
		.OverviewVisible = -1
	endwith
	.ColumnAutoResize = .F.
	.ContinueColumnScroll = .F.
	rs = CreateObject("ADOR.Recordset")
	with rs
		.Open("Orders","Provider=Microsoft.ACE.OLEDB.12.0;Data Source=C:\Program Files\Exontrol\ExGantt\Sample\Access\SAMPLE.MDB",3,3)
	endwith
	.DataSource = rs
	.AutoDrag = 16
	.EndUpdate
endwith
|
|
805
|
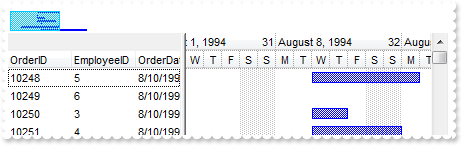
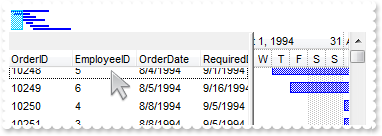
How do I load bars from my ADO table/database
*** AddItem event - Occurs after a new Item has been inserted to Items collection. ***
LPARAMETERS Item
	with thisform.Gantt1
		with .Items
			.AddBar(Item,"Task",.CellCaption(Item,2),.CellCaption(Item,4))
		endwith
	endwith

with thisform.Gantt1
	.BeginUpdate
	with .Chart
		.FirstVisibleDate = {^1994-8-3}
		.PaneWidth(0) = 256
		.LevelCount = 2
		.UnitScale = 4096
		.FirstWeekDay = 1
		.OverviewVisible = -1
	endwith
	.ColumnAutoResize = .F.
	.ContinueColumnScroll = .F.
	rs = CreateObject("ADOR.Recordset")
	with rs
		.Open("Orders","Provider=Microsoft.ACE.OLEDB.12.0;Data Source=C:\Program Files\Exontrol\ExGantt\Sample\Access\SAMPLE.MDB",3,3)
	endwith
	.DataSource = rs
	.EndUpdate
endwith
|
|
804
|
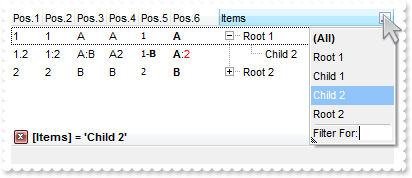
Is it possible to auto-numbering the children items but still keeps the position after filtering
with thisform.Gantt1
	.BeginUpdate
	.Chart.PaneWidth(1) = 0
	.LinesAtRoot = -1
	with .Columns.Add("Items")
		.DisplayFilterButton = .T.
		.FilterType = 240
		.Filter = "Child 2"
	endwith
	with .Columns.Add("Pos.1")
		.FormatColumn = "1 ropos ''"
		.Position = 0
		.Width = 32
		.AllowSizing = .F.
	endwith
	with .Columns.Add("Pos.2")
		.FormatColumn = "1 ropos ':'"
		.Position = 1
		.Width = 32
		.AllowSizing = .F.
	endwith
	with .Columns.Add("Pos.3")
		.FormatColumn = "1 ropos ':|A-Z'"
		.Position = 2
		.Width = 32
		.AllowSizing = .F.
	endwith
	with .Columns.Add("Pos.4")
		.FormatColumn = "1 ropos '|A-Z|'"
		.Position = 3
		.Width = 32
		.AllowSizing = .F.
	endwith
	with .Columns.Add("Pos.5")
		.FormatColumn = "'<font Tahoma;7>' + 1 ropos '-<b>||A-Z'"
		.Def(17) = 1
		.Position = 4
		.Width = 32
		.AllowSizing = .F.
	endwith
	with .Columns.Add("Pos.6")
		.FormatColumn = "'<b>'+ 1 ropos '</b>:<fgcolor=FF0000>|A-Z|'"
		.Def(17) = 1
		.Position = 5
		.Width = 48
		.AllowSizing = .F.
	endwith
	with .Items
		h = .AddItem("Root 1")
		.InsertItem(h,Null,"Child 1")
		.InsertItem(h,Null,"Child 2")
		.ExpandItem(h) = .T.
		h = .AddItem("Root 2")
		.InsertItem(h,Null,"Child 1")
		.InsertItem(h,Null,"Child 2")
	endwith
	.ApplyFilter
	.EndUpdate
endwith
|
|
803
|
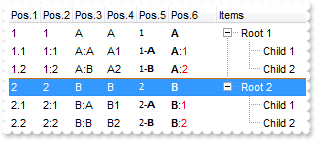
Is it possible to auto-numbering the children items too
with thisform.Gantt1
	.BeginUpdate
	.Chart.PaneWidth(1) = 0
	.LinesAtRoot = -1
	.Columns.Add("Items")
	with .Columns.Add("Pos.1")
		.FormatColumn = "1 rpos ''"
		.Position = 0
		.Width = 32
		.AllowSizing = .F.
	endwith
	with .Columns.Add("Pos.2")
		.FormatColumn = "1 rpos ':'"
		.Position = 1
		.Width = 32
		.AllowSizing = .F.
	endwith
	with .Columns.Add("Pos.3")
		.FormatColumn = "1 rpos ':|A-Z'"
		.Position = 2
		.Width = 32
		.AllowSizing = .F.
	endwith
	with .Columns.Add("Pos.4")
		.FormatColumn = "1 rpos '|A-Z|'"
		.Position = 3
		.Width = 32
		.AllowSizing = .F.
	endwith
	with .Columns.Add("Pos.5")
		.FormatColumn = "'<font Tahoma;7>' + 1 rpos '-<b>||A-Z'"
		.Def(17) = 1
		.Position = 4
		.Width = 32
		.AllowSizing = .F.
	endwith
	with .Columns.Add("Pos.6")
		.FormatColumn = "'<b>'+ 1 rpos '</b>:<fgcolor=FF0000>|A-Z|'"
		.Def(17) = 1
		.Position = 5
		.Width = 48
		.AllowSizing = .F.
	endwith
	with .Items
		h = .AddItem("Root 1")
		.InsertItem(h,Null,"Child 1")
		.InsertItem(h,Null,"Child 2")
		.ExpandItem(h) = .T.
		h = .AddItem("Root 2")
		.InsertItem(h,Null,"Child 1")
		.InsertItem(h,Null,"Child 2")
	endwith
	.EndUpdate
endwith
|
|
802
|
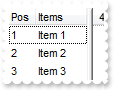
Is there any way to add auto-numbering
with thisform.Gantt1
	with .Columns
		.Add("Items")
		with .Add("Pos")
			.FormatColumn = "1 pos ''"
			.Position = 0
		endwith
	endwith
	with .Items
		.AddItem("Item 1")
		.AddItem("Item 2")
		.AddItem("Item 3")
	endwith
endwith
|
|
801
|
How can I format my column to display the percent values “5,00%”

with thisform.Gantt1
	.Columns.Add("Percent").FormatColumn = "((dbl(value) * 100) format '2|,|3.')+'%'"
	with .Items
		.AddItem(0.5)
		.AddItem(0.4)
		.AddItem(0.75)
	endwith
endwith
|